Feature #594

Site status history dashboard
Start date:
04/10/2013
Due date:
% Done:
100%
Description
Build a dashboard that shows the history of a site status.
This should include:
- A form element that allows of selection of the time period
- A form element that allows users to filter by URL and or title
- Single value modules listing the average and maximum response times
- A chart illustrating the response times broken out by connection and request time
- A table listing the past statuses
History
#1
 Updated by Luke Murphey almost 13 years ago
- Target version set to 0.8
#2
Updated by Luke Murphey almost 13 years ago
- File mypingdom.png View added
#3
Updated by Luke Murphey almost 13 years ago
- File feature-monitor.png View added
See 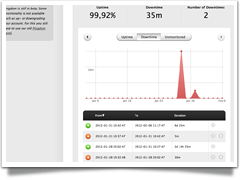 and
and 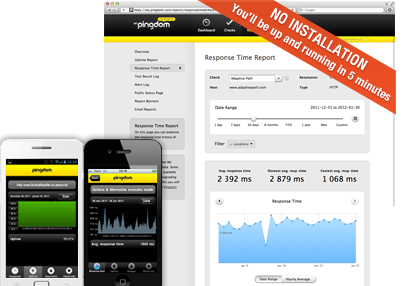 for similar concepts.
#4
Updated by Luke Murphey almost 13 years ago
- Status changed from New to In Progress
#5
Updated by Luke Murphey almost 13 years ago
I currently don't treat empty response codes as failures. See:
sourcetype="web_ping" title="TextCritical.net" | eval down=if(response_code>=400,1,if(timed_out=="True", 1, 0) )
#6
Updated by Luke Murphey almost 13 years ago
See http://splunk-base.splunk.com/answers/58335/change-chart-bar-color-based-on-data-value for an approach to color items in a chart.
#7
Updated by Luke Murphey almost 13 years ago
- Status changed from In Progress to Closed
- % Done changed from 0 to 100
#8
Updated by Luke Murphey over 12 years ago
- Target version changed from 0.8 to 0.7